Publish your application as JavaScript
that mashes up the Linked Open Data
Application Information


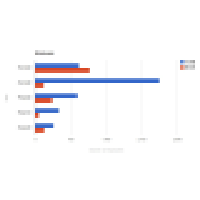
経産省の調査による都道府県ごとの雇用予定者数を、年度別で棒グラフで表示するアプリです。プルダウンメニュー内でCtrlキーを押しながら都道府県名を複数クリックすると、グラフが複数表示されます。
1
Rating
useful
0
Loading...
Application
| |||||||||||||||||||||||

| Contributor | ||
|---|---|---|
| Forked from (Parent App) |
 Uditha Punchihewa
's
統計データを棒グラフで表示するアプリ
Uditha Punchihewa
's
統計データを棒グラフで表示するアプリ
|
|
| Run count | 367 | |
| Website | ||
| License |

|
|
| Fork count | 1 | |
| Created date | Jun 12, 2012 | |
| Last update date | Jun 26, 2012 | |
Forked from (Parent App)
 統計データを棒グラフで表示するアプリ
Update: Jun 11, 2012
714 runs
統計データを棒グラフで表示するアプリ
Update: Jun 11, 2012
714 runs
Forked (Child App)
 統計データをアニメーション棒グラフで表示
Update: Jun 26, 2012
409 runs
統計データをアニメーション棒グラフで表示
Update: Jun 26, 2012
409 runs
- LinkData work list used as input data in this application.
- You can change input data and execute application if you change the checkbox.
